Tracking COVID-19 Vaccinations in Ontario
Jason and I have been collecting data from the Ontario Government's COVID-19 vaccination statistics and started to graph them in Grafana.
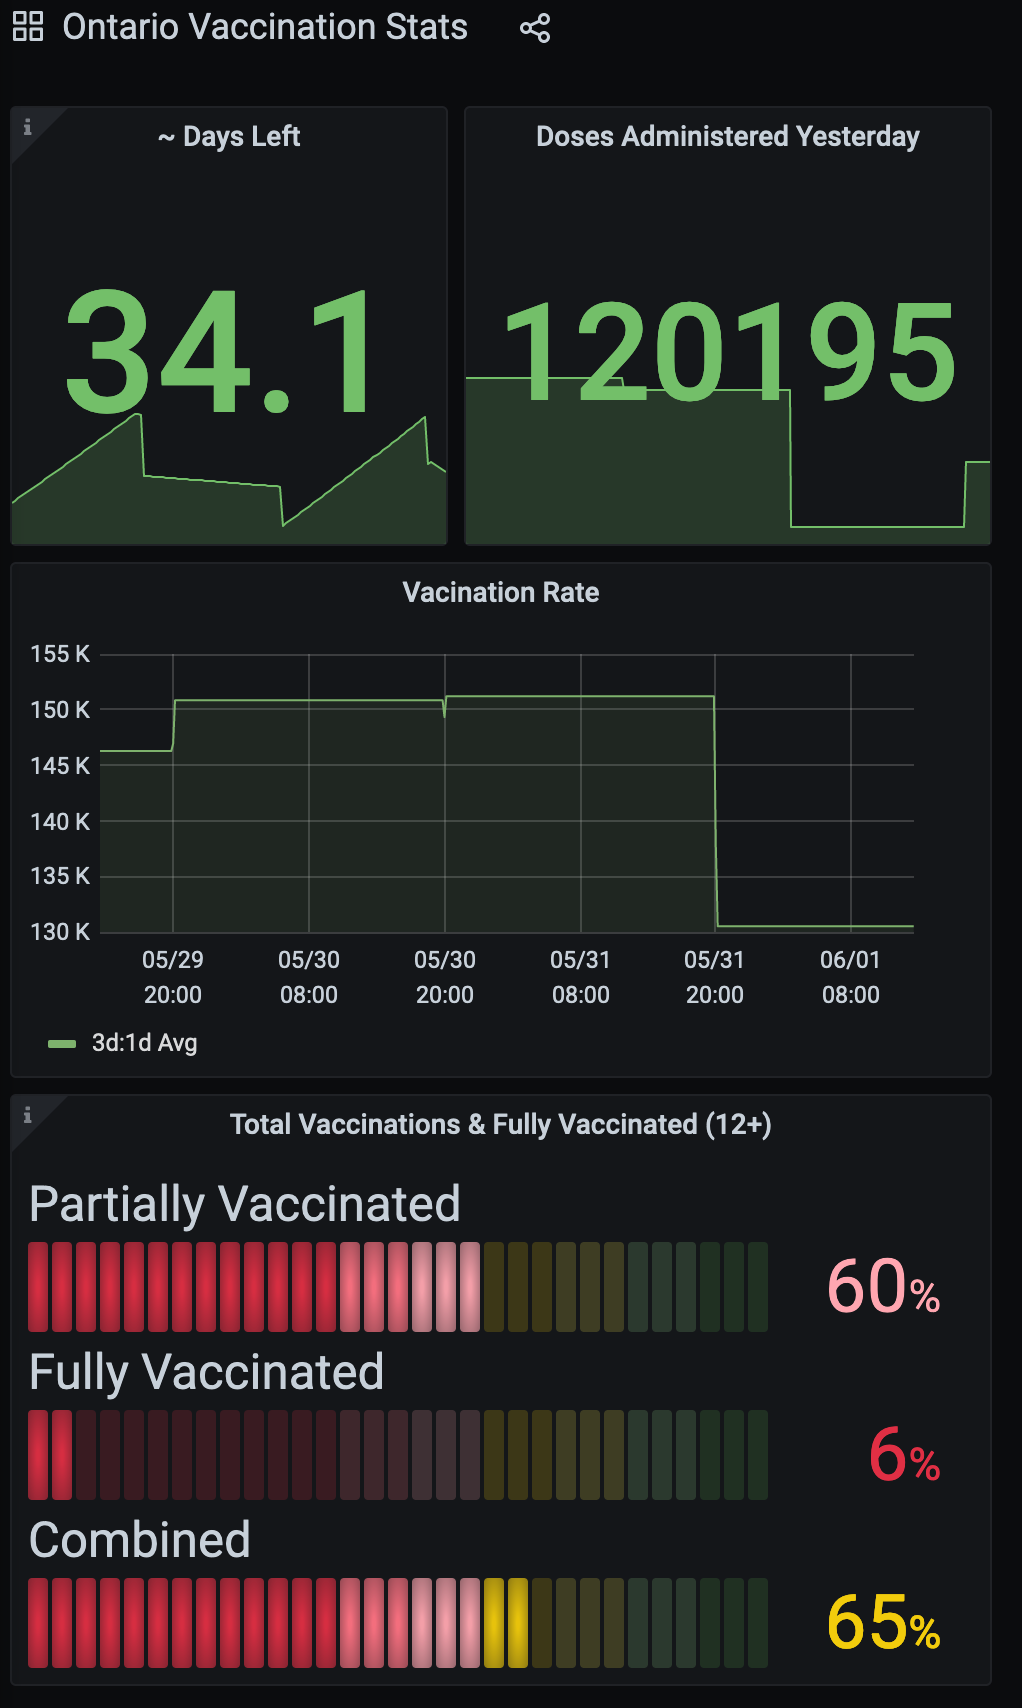
You can find the graph at https://monitor.sdf1.net/dashboard/snapshot/ontvacstats which is updated every hour. The Prometheus agent that collects the stats was written in Go and can be found at my GitTea page
Its been a fun little exercise in collecting the data, exposing it to prometheus, and then graphing it in Grafana as a side project. I do a lot of work with these kinds of tools in my day job but it was nice to do it with low pressure and be able to feel like I was doing something during these times.